Along with more specific questions, I asked people who took the SSC survey to rate their experience with the mental health system on a 1 – 10 scale.
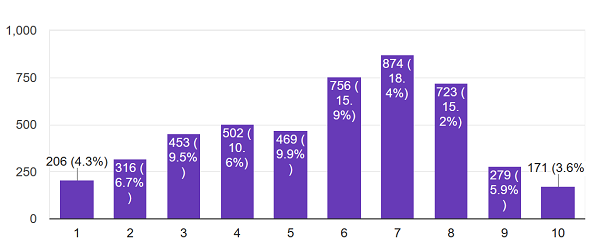
About 5,000 people answered. On average, they rated their experience with psychotherapy a 5.7, and their experience with medication also 5.7.
This is more optimistic than a lot of the horror stories you hear would suggest. A lot of the horror stories involve inpatient commitment (which did get a dismal 4.4/10 approval rating) so I checked what percent of people engaging with the system ended up inpatient. Of people who had seen either a psychiatrist or therapist, only 7% had ever been involuntarily committed to a psychiatric hospital. Note that this data can’t tease out causation, so this doesn’t mean 7% of people who saw an outpatient professional were later committed – it might just mean that lots of people got committed to the hospital by police, then saw a professional later.
Going into more detail about what people did or didn’t like (note truncated y-axis):
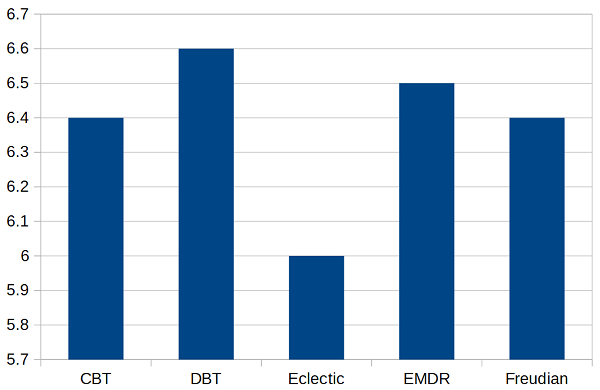
I asked people what kind of therapy they did. People liked all schools of therapy about the same, except that they liked “eclectic” therapy that wasn’t part of any specific school less than any school. Every school including eclectic got higher than 5.7, because people who wouldn’t answer this question – who weren’t even sure what kind of therapy they were doing – rated it less than any school or than eclectic therapy.
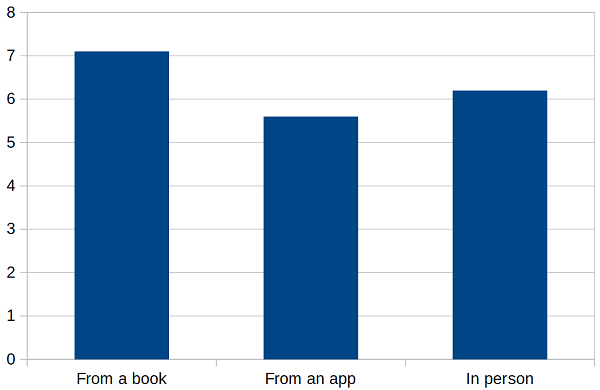
People really liked doing therapy from a book. They liked doing therapy with an in-person therapist a little less, and they liked online therapy apps least of all. This doesn’t match published literature, and this would be a good time to remember that all of these results are horribly biased and none of them can prove causation. For example, the sort of motivated go-getter who would go out and get a therapy book and read it themselves might be systematically different from somebody who gets therapy through an app or in a clinic.
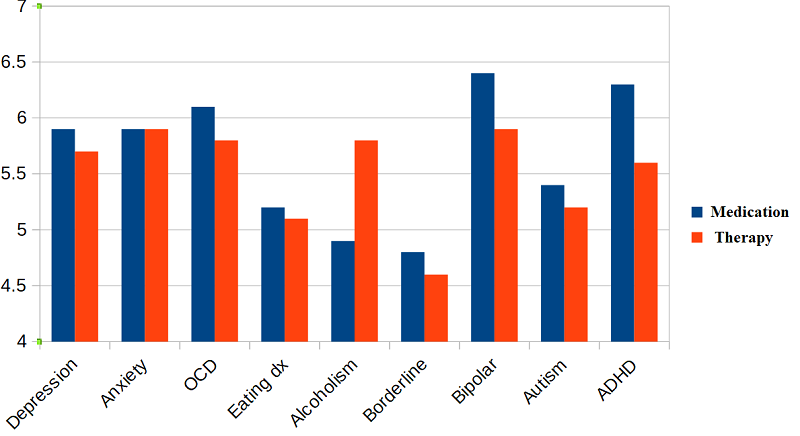
This graph shows how people liked medication (blue) and therapy (red) based on what their mental health issue was (note truncated y-axis). Some groups – people with eating disorders, people with borderline personalities – were just generally hard to please. Alcoholics were much happier with their therapy than with pharmaceutical treatment (though the sample size was only about 50 per group). People with bipolar and ADHD were happier with medication than therapy.
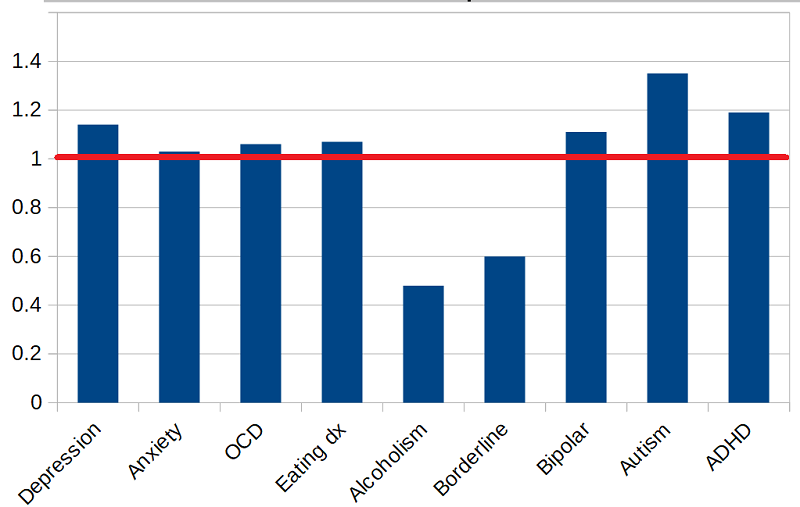
This is a little different. The last graph averaged everyone’s opinion of medication and everyone’s opinion of therapy. This one just includes the people who have tried both, who might have a better standard for comparison. The higher the bar above the red line, the more they preferred the medication; the lower the bar below the red line, the more they preferred the therapy.
Alcoholics and borderlines prefer the therapy. Autistic people strongly prefer the medication, which is weird because there’s no good medication for autism. This could be them hating the social interaction involved in therapy. Or it could be a condemnation of therapies like applied behavior analysis, which can become a sort of confrontational attempt to force them to conform, with potential punishment for failure. The ADHD preference for medication is less surprising; stimulants always get a high approval rating.
Remember, none of these numbers measure whether treatment works – just whether patients are happy. And they’re all vulnerable to selection effects and a host of other biases. Take them as exploratory only. I welcome people trying to replicate or expand on these results. All of the data used in this post are freely available and can be downloaded here.